Lead Management and ROI Measurement for Real Estate Projects
Most reports sent to a developer stop at cost per lead. The decisions that matter, which channel to expand, which to close and when, require a different metric: cost per signed deal. This page sets out the full measurement chain from first click to contract, with formulas, an illustrative calculation and a weekly report structure.
The playbook at a glance
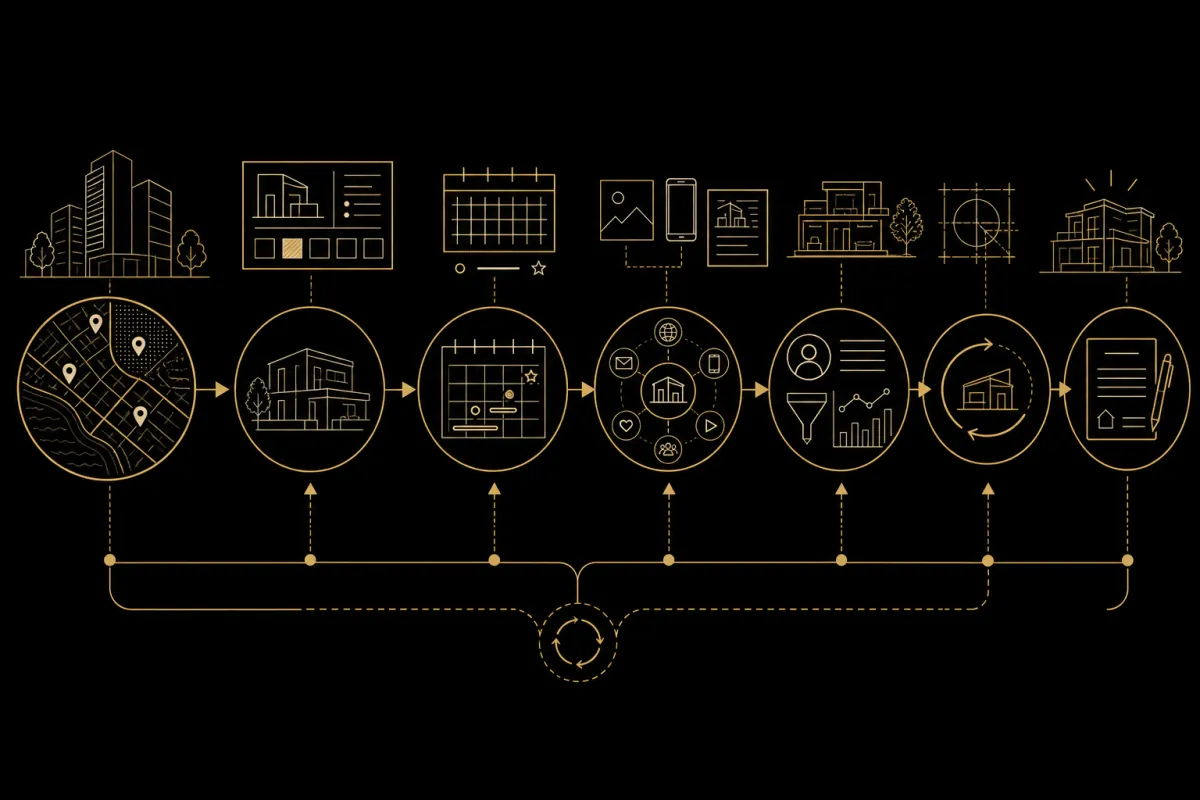
Research, launch, measure, improve
Use the guide as a sequence rather than a menu of tactics. Each stage creates the inputs needed by the next one.
- Market map
- Launch plan
- Lead system
- Optimization loop
The Short Answer: Measure Cost per Deal, Not Cost per Lead
Real estate project lead management is one continuous process. Every inquiry from every channel enters one CRM pipeline, receives complete source attribution, passes through suitability screening and moves through defined stages until a deal, or until it is marked lost with a recorded reason. ROI measurement begins only when each stage is counted and costed: cost per unique inquiry, cost per qualified lead, cost per held meeting and cost per signed deal. A campaign is judged by what it produces at the end of the chain, not by how inexpensive the lead looks at the beginning. Without that infrastructure, every discussion of what works is a polite guess.
This page explains the measurable part of the CRM, automation and measurement layer we build for projects: the connection between marketing spend and signed contracts, a connection that few industry reports reach.
Why Cost per Lead Alone Misleads
Cost per lead is the industry's default metric because it is easy to measure and present. It is also the easiest to distort. A broad audience and generic message produce inexpensive leads, most of which are irrelevant. A precise audience and focused message produce more expensive leads, a larger share of which reaches a meeting. Anyone comparing channels on CPL alone may close the channel that actually generates deals.
A second distortion comes from counting conversions instead of unique inquiries. The same buyer completes a form, calls and sends a WhatsApp message, becoming three conversions in platform reports. A third distortion follows when both Google Ads and Meta claim the same deal because each platform measures itself. The combined result is an attractive report and a misallocated budget.
In a market where everyone sells qualified leads, the one figure that cannot be polished is cost per signed deal.
A Qualified Lead: An Operating Definition, Not a Slogan
Define before measuring. "Qualified lead" is an overused promise precisely because few suppliers define it. Our definition is operational and uses the fields we record in our own pipeline: budget, preferred city, transaction type, planned purchase timing, language and full source attribution, including UTM and click IDs, first touch and last touch. A qualified lead for a project meets the pre-agreed threshold for budget, location and timing and is willing to speak.
Marketing and sales must write and approve this definition before the first campaign. Otherwise each team measures something different and blames the other. Screening, scoring and response times are covered in detail in How to Generate Qualified Real Estate Leads.
Pipeline Stages: From New Lead to Deal, Including Lost
These are the nine stages we recommend for a residential project. Each has an unambiguous entry condition so figures remain comparable from week to week and from one salesperson to another.
| Stage | Entry Condition | What the Figure Shows |
|---|---|---|
| New lead | Unique inquiry after duplicate screening | Real volume by source |
| Contact made | First two-way call or written exchange | Response quality and speed |
| Qualified | Meets the suitability definition agreed in advance | Accuracy of targeting and message |
| Meeting scheduled | Calendar time confirmed by the buyer | Ability of the call script to secure the next step |
| Meeting held | Physical or video meeting that actually occurred | Attendance rate and coordination quality |
| Information sent | Offer, specification or payment plan sent after a meeting | Serious continuation after the meeting |
| Negotiation | Active discussion of a specific unit and terms | Depth of the commercial pipeline |
| Deal | Signed contract | The bottom line of the full investment |
| Lost plus reason | Exit from the process with a reason selected from a closed list | Where and why buyers are lost |
The final stage matters as much as the deal. "Lost" without a reason is lost data. A closed list of reasons, such as price, location, financing, occupancy timing, purchase in another project or no answer, turns failure into management information. It can reveal that the problem is not marketing at all, but pricing or inventory.
Six Infrastructure Components Without Which the Numbers Are Wrong
Every source enters one pipeline
Website forms, landing pages, Meta lead forms, Google Ads, phone calls, WhatsApp and manually entered inquiries all enter one system with automatic source attribution. An inquiry recorded in a salesperson's notebook does not exist in the report.
Cleaning and duplicate screening
Normalize phone numbers, merge by phone and email, and preserve the first source when the buyer returns through another channel. Without this, CPL looks better than reality while close rates look worse. Both reports mislead in the same direction.
Call and WhatsApp tracking
In many projects, a significant share of inquiries arrives by phone and message rather than forms. Use tracking numbers by channel, record calls and preserve the conversation in the contact record. An unattributed phone inquiry becomes "direct" and distorts every channel comparison.
A response-time SLA with alerts
A lead left waiting for a day cools, and one left for a week may already have met a competitor. Set a response target in minutes and hours, measure median response time by source and shift, and trigger alerts and escalation when an inquiry exceeds the target.
Lead scoring and routing
Score for fit, including budget, city and timing, and behavior, including answering a call, requesting a specification and returning to the site. Hot leads route to a senior representative in real time. Others enter structured nurture rather than disappearing.
Tracking through the deal and back to campaigns
Open an opportunity with value and date for every active negotiation, and preserve full source attribution on each signed contract. Return deal data to advertising platforms so their algorithms learn to find buyers rather than form fillers.
Source Attribution: First Touch, Last Touch and the Truth Between Them
An apartment buyer almost never converts after one interaction. They see an ad, search for the project name a week later, visit the page, return through remarketing and call after another two weeks. A last-touch model gives all credit to the phone call. A first-touch model gives it all to the first advertisement. Each is partly right and misleading on its own.
Our practical doctrine is to preserve both first and last touch on every record, read them together and not pretend one model is the truth. Multi-touch models sound impressive in presentations, but a single project's inquiry volume rarely supports a reliable statistical model. Two recorded touches answer most management questions: what opens the funnel and what closes it.
The Formulas: Cost per Meeting, Opportunity and Deal, With an Example
Every report should show five formulas by source:
- Cost per unique inquiry = media spend divided by unique inquiries after duplicate screening
- Cost per qualified lead = media spend divided by leads that met the suitability definition
- Cost per meeting = media spend divided by meetings actually held
- Cost per opportunity = media spend divided by entries into active negotiation
- Cost per signed deal = total marketing cost, including media, management and production, divided by signed contracts
Media spend alone is enough for continuing channel comparison. Full cost per signed deal should include management fees and asset production. The following example is illustrative only:
| Metric | Channel A: Cheap Lead | Channel B: Expensive Lead |
|---|---|---|
| Monthly media spend | ₪100,000 | ₪100,000 |
| Unique inquiries | 400 | 200 |
| Cost per inquiry | ₪250 | ₪500 |
| Qualified | 80 (20%) | 90 (45%) |
| Meetings held | 24 | 40 |
| Cost per meeting | ₪4,167 | ₪2,500 |
| Deals | 2 | 5 |
| Cost per signed deal | ₪50,000 | ₪20,000 |
By CPL, Channel A wins by a factor of two. By cost per deal, Channel B is two and a half times less expensive. If the project's average apartment sells for ₪2.4 million, Channel B's marketing cost per deal is below 1% of revenue, compared with more than 2% for Channel A. The same budget leads to the opposite decision.
This numerical example is illustrative only. The figures are not client data, an industry average or a performance promise. Relationships between stages vary by project, city, audience and sales stage.
A Weekly Report a CEO Will Actually Read
A useful report is one page, not twenty. It is organized by source and campaign, shows the full stage chain and ends with decisions. Its blocks are:
- Volume and cost by source: new inquiries, duplicates removed and cost per unique inquiry
- Quality: qualified leads, qualification rate and cost per qualified lead
- Response pace: median response time, untreated inquiries and SLA breaches
- Progress: meetings scheduled, meetings held, active negotiations and signed deals
- Lost leads: breakdown by reason and trend against prior weeks
- Bottom line: cost per meeting and deal by source, with the change from last week
- Three decisions for the coming week: what to expand, what to stop and what to test
The final block is why the report exists. A report that does not lead to a decision is a ritual, not a management tool.
Finding the Bottleneck Between Marketing and Sales
With a measured pipeline, the old argument between bad leads and weak sales becomes a diagnosis. A sharp fall between two stages points to a different problem each time:
| Symptom | Likely Diagnosis | Where to Intervene |
|---|---|---|
| Many inquiries, few contacts made | Slow or missing response, insufficient staffing | Call team, automation and response targets |
| Contact made, few qualified leads | Targeting too broad or a misleading message | Audiences, creative and landing page |
| Qualified leads, few meetings | Weak call script or an unattractive offer | Sales and marketing together |
| Meetings, few deals | Pricing, inventory or payment terms | Management, not campaigns |
The report is not designed to blame anyone. It identifies where the next shekel produces the greatest return. Sometimes the answer is not more media, but another representative or a change to payment terms.
Common Project Marketing Measurement Mistakes
Counting conversions instead of people
Three inquiries from one buyer are not three leads. Duplicate screening by phone and email precedes every cost calculation.
No basic measurement at all
One published industry review found that roughly half of 102 real estate companies examined operated without a properly installed measurement pixel. What is not measured cannot be improved.
Judging a channel after one week
The apartment purchase cycle is long. Evaluate a channel with a sufficient inquiry sample and advanced funnel stages, not its first twenty leads.
Closing the expensive channel
A channel with twice the CPL and a lower cost per deal is the less expensive channel. Compare at the end of the funnel, not the beginning.
Managing leads in spreadsheets
Without timestamps, source attribution and call records there is no response time, lost-reason analysis or learning. A spreadsheet is a report, not a management system.
Relying on platform dashboards
Google and Meta each report on themselves and may claim the same deal. The CRM is the source of truth, and platforms reconcile to it.
The System We Operate for Ourselves
We do not recommend infrastructure we have not run. We first built this system for our own platform: one HubSpot pipeline, Make automations, GA4 measurement with event-level duplicate prevention, call recording and transcription, WhatsApp inquiry capture, and follow-up sequences with a daily cap, automatic stop on reply and no sending on Shabbat.
Source: HubSpot CRM and Google Search Console for semerenkogroup.com, checked July 2026.
These are figures from our platform, not client results. We do not publish case studies until genuine, verified material exists. The full method and what we can show today appear on our Results and Methodology page. This operating system also supports every real estate marketing service for developers and contractors that we provide.
Checklist Before Approving More Media Budget
- Every source enters one pipeline, including phone and WhatsApp
- First touch and last touch are recorded for every inquiry
- Duplicates are removed by phone and email before any cost calculation
- A written qualified definition is agreed by marketing and sales
- Median response time is measured, with a target and breach alerts
- Every lost lead receives a reason from a closed list
- The weekly report shows cost per meeting and deal by source
- One person is responsible for reading the report and making three decisions each week
If three or more items remain unchecked, budget is probably not the problem. More media on broken infrastructure produces more lost leads, not more deals.
Request a Sample Report Structure for Your Project
Leave your details and we will send a complete weekly report structure using the fields we work with in practice, then review how it should fit your project. A practical conversation, without a presentation.